Unit 2 Project
Intro
I obtained some stats from NBA.com and salaries from ESPN.com where I scraped the data. I combined the data together which gave me a set of all players in the National Basketball Association from all 30 teams. I am using only the active players who have stats.
Target
I wanted to predict how much an incoming player could earn (in USD) with the stats they would provide the franchise over the course of a season.
What I Thought
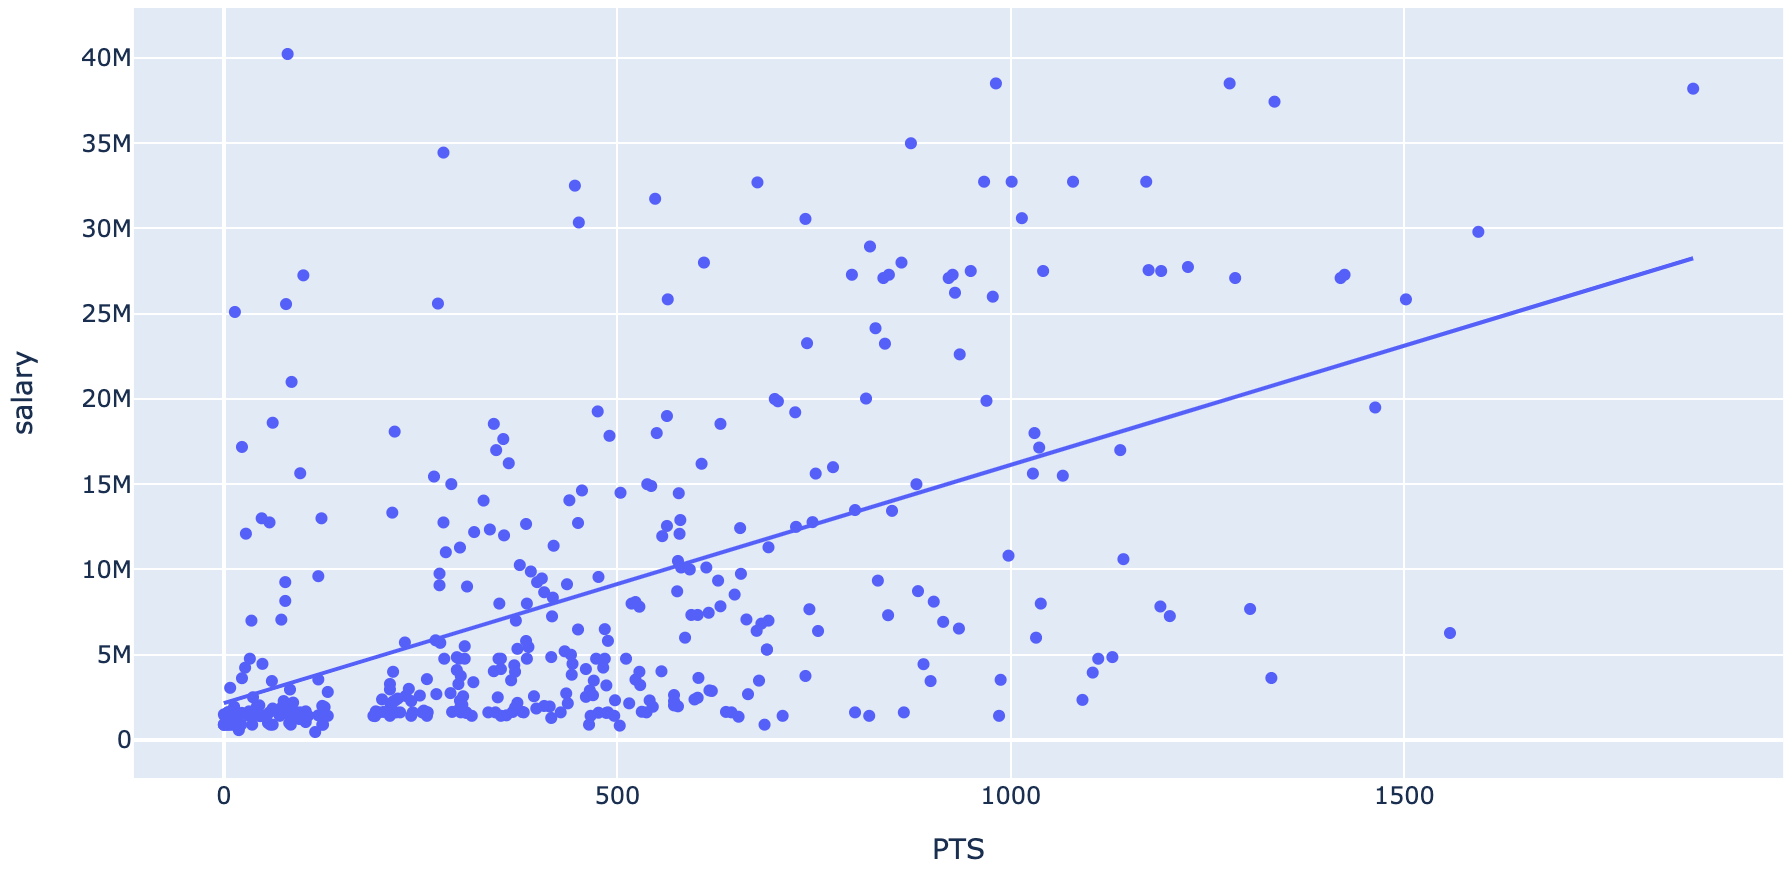
One important thing is to know which stats are most important. I figured off the top of my head, and throughout my years of playing basketball myself, high school and college (being a member of the 7-footer club, how could I not play?), that the number of points a player could make would be the leading factor in how much money they would earn as a professional athlete. I was surprised when I discovered I was wrong. The number of points wasn’t even in the top 5 stats.
So I plotted it, and continued to stick with what I thought.
Baseline Score
When talking about basketball, the baseline score may be a bit confusing. You may think I’m trying to figure out how many players can score from the baseline… or some variation of that. However, for the baseline score, what I’m doing is taking the mean salary of the players, which is $8,516,607 and figuring the mean absolute error, which is the absolute difference between each player’s salary and the mean. It comes to $7,025,639.
Linear Regression
As I continued my searching predictions I used the points value to generate a model that, given a player who would score 1500 points, predicted a salary of $24,853,148, but now we have a baseline to work with which means the range could be $7,025,639 more or less than the predicted salary (between $17,827,509 & $31,878,787). So, an incoming player can assume that for every single point they score, based on scoring alone, they can expect to average around $15,693 per point.
Top Ten Stats
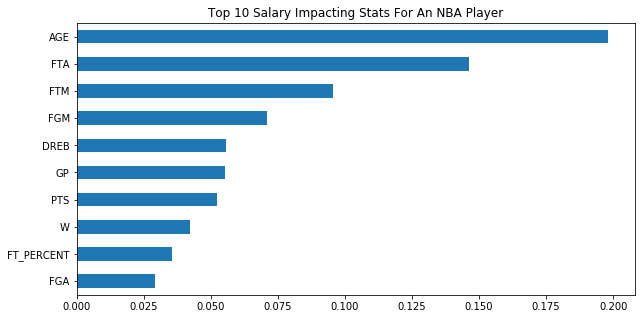
Note: As we see below, I was wrong about the points.
In order of the impact on salary, these are the top ten stats.
- Age
- Free Throws Attempted
- Free Throws Made
- Field Goals Made
- Defensive Rebounds
- Games Played
- Points Scored
- Wins
- Free Throw Percentage
- Field Goals Attempted
…and it keeps going.
Decision Tree
For your admiration (click to enlarge):
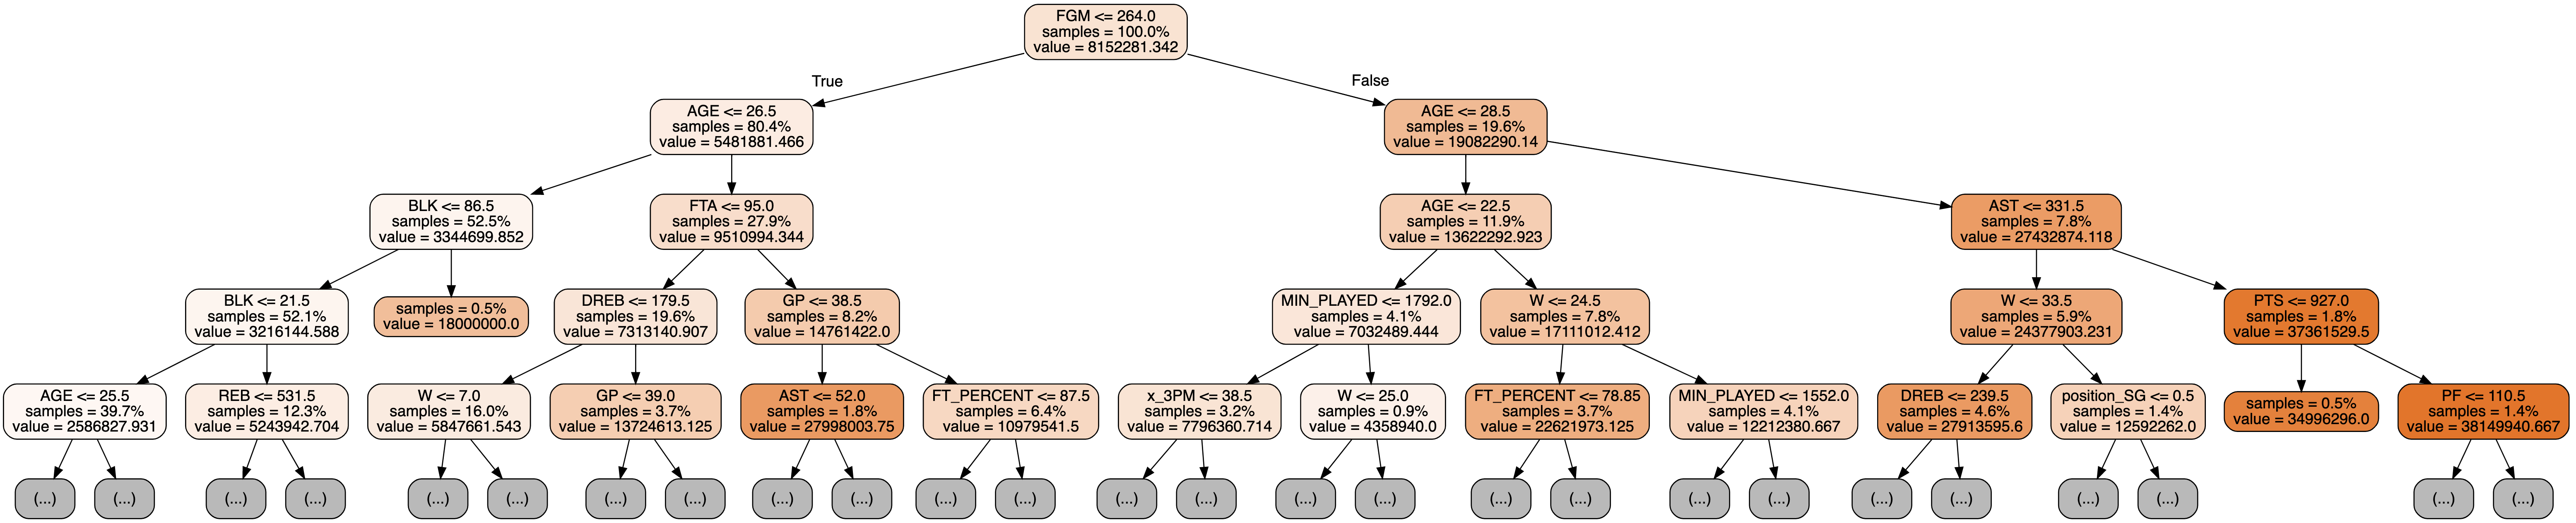
This method tested at a hair over 84% when running it on my training data, which was very impressive, however, it validated just barely over 42%.
Random Forest
I also managed to pull off a random forest model which came back with a validation accuracy of 46%.
XGBoost
The XGBoost model came back with a gradient boosting R^2 39.7% accuracy on the validation.
PDPs (Partial Dependency Plot)
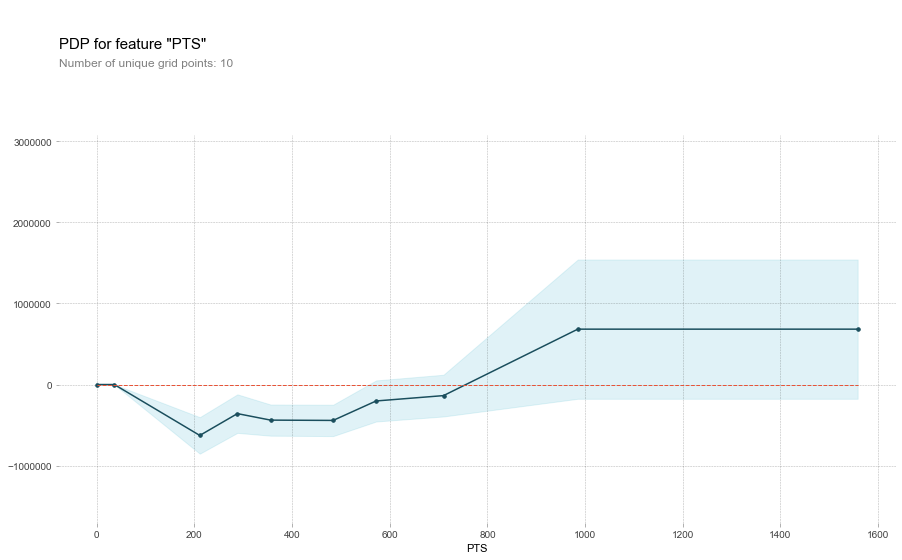
Points
On average, as a player adds to their point total, the predicted salary goes down until they reach about 200 points, then it begins to go up.
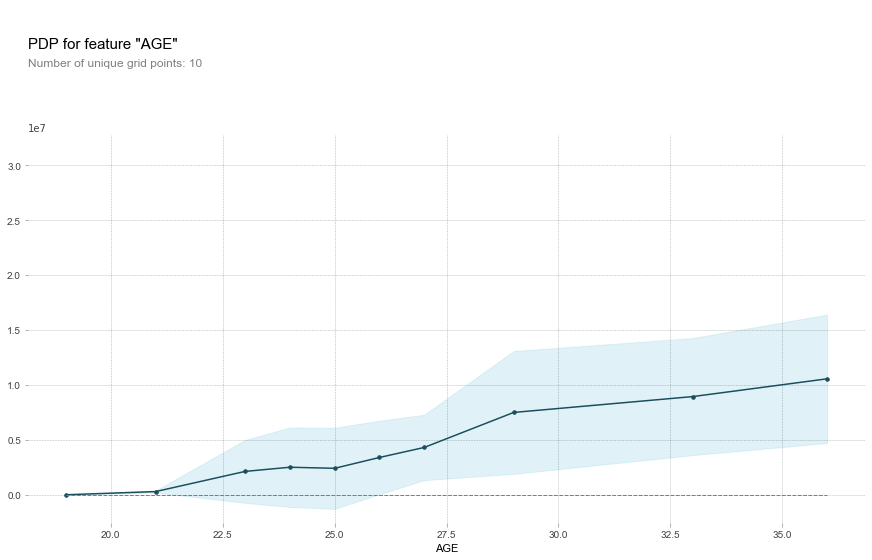
Age
Here we see that as a player ages, on average, their salary is predicted to increase. I can only speculate that this has to do with the fact that they’ve likely been playing longer and have much more professional experience, hence the player is more valuable and worth more.
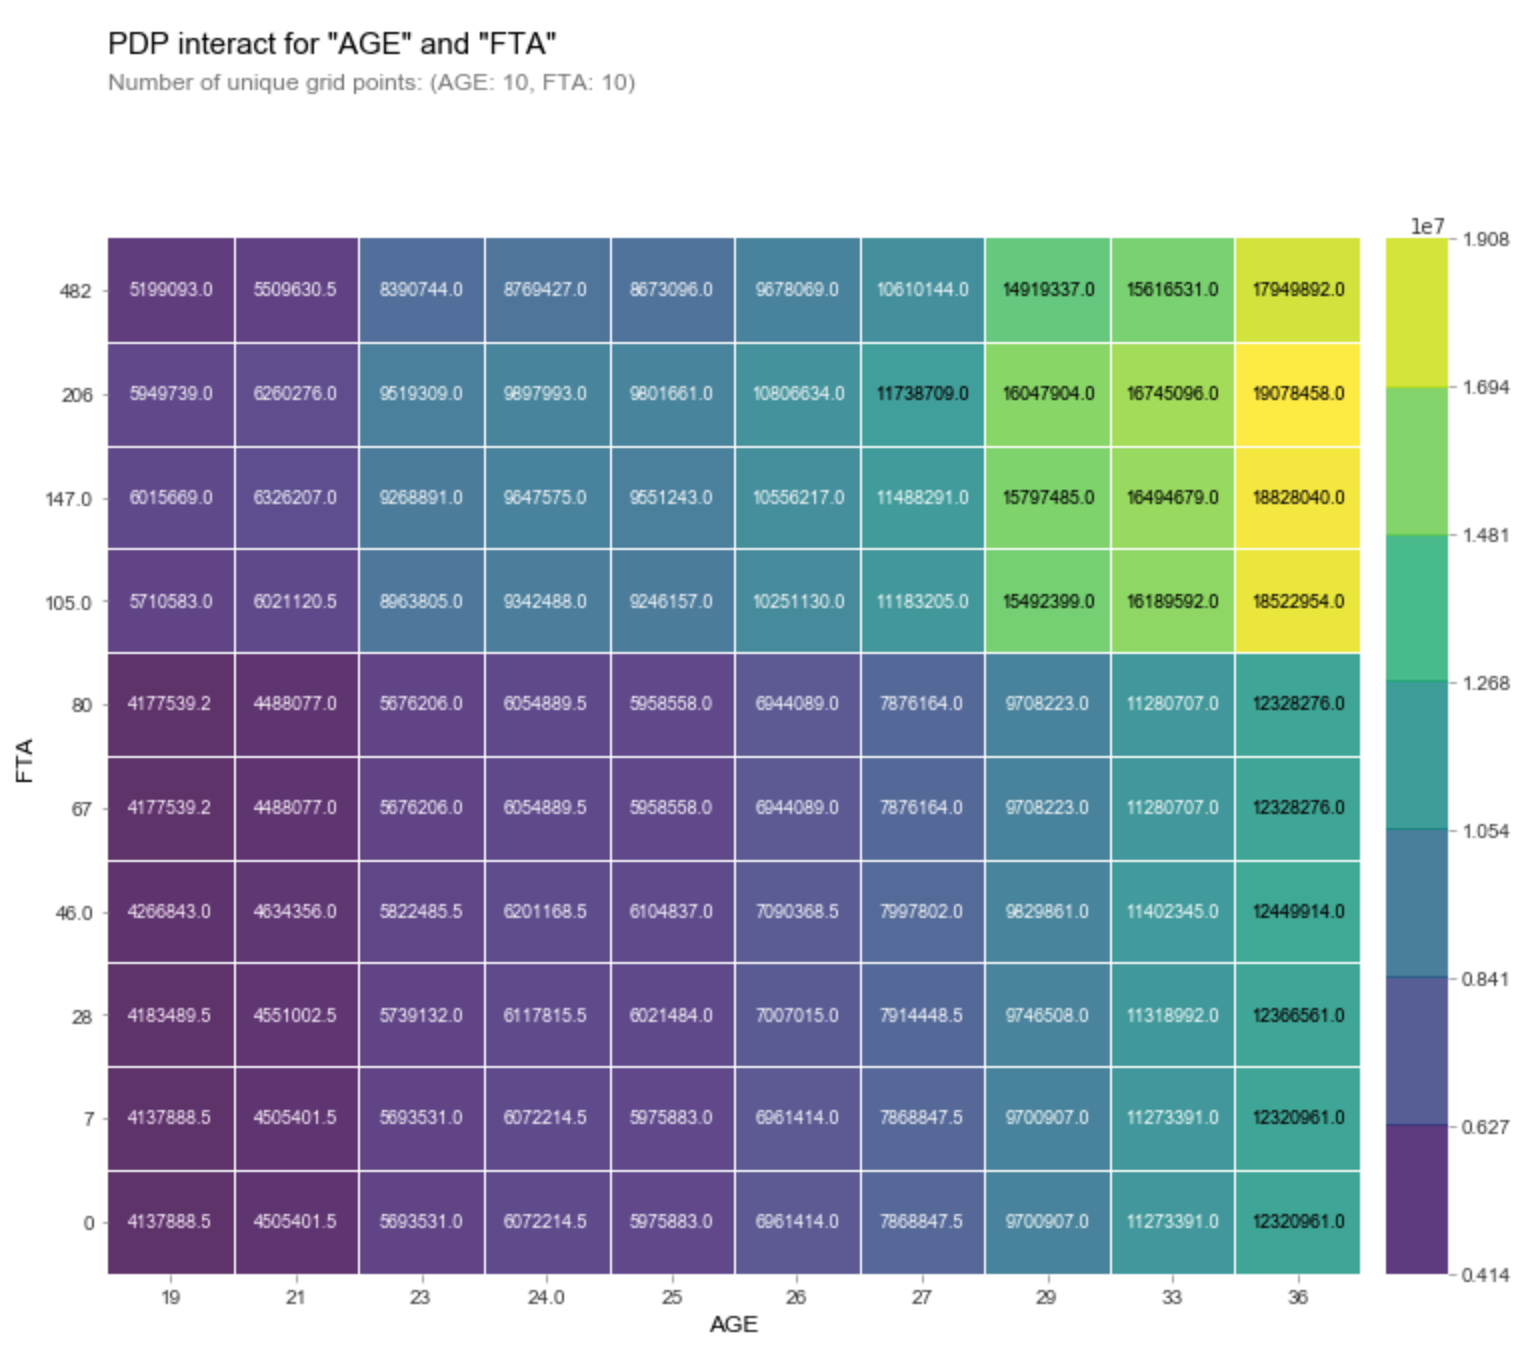
Age & Free Throw Attempts
Strictly based on a players age and their free throw attempts, regardless if they score or not, a 36-year-old athlete who goes to the line 482 times, is predicted to make (the top right corner) $17,949,892. But there are other stats required to get the attempts at the line, so although this is fun to know, it’s not realistic that any team is going to have a player who doesn’t play any minutes yet gets to attempt 482 free throws… or any at all. Point is, one must have other stats, which affect the salary also. I chose these two, because they have the biggest impact on a salary, as seen above.
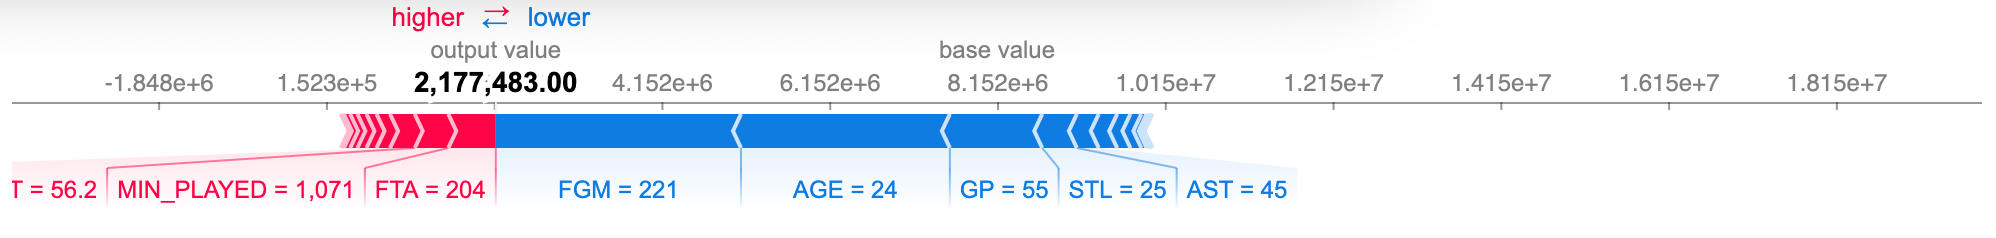
Shaps
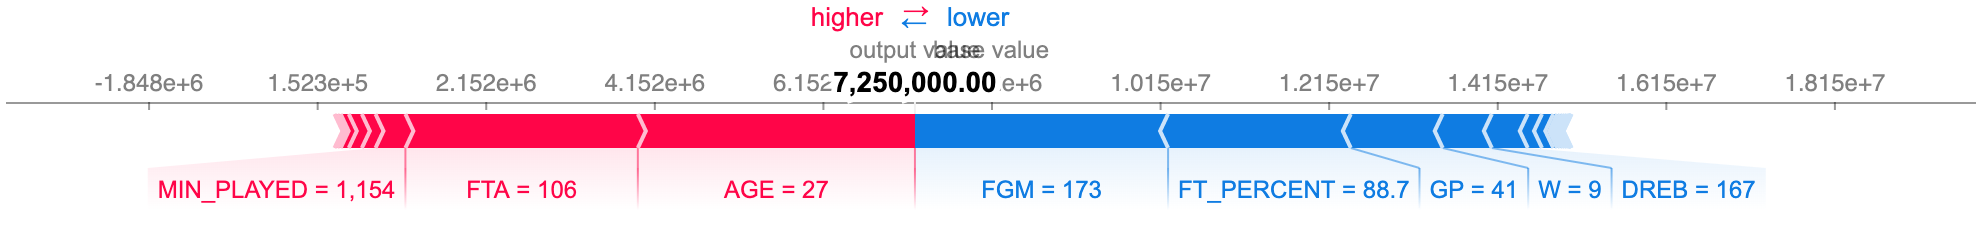
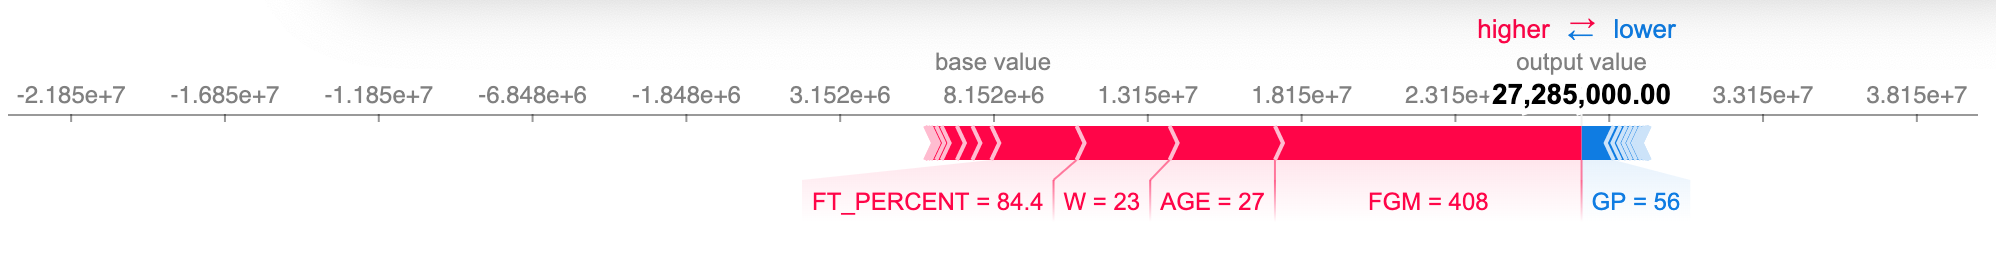
Below are five examples of players and the stats they provide, with the associated predicted values (salary) and the biggest weights per example.
To understand these images, know that the RED bars raise the salary, and the BLUE bars lower it. The bigger the width of each individual section, the bigger the impact.
And don’t let the scientific notation intimidate you. Just know it represents the salary.
KEY:
Position (may be: Shooting Guard, Power Forward, Small Forward, Point Guard, Center, Forward, Guard)
Age
Games Played
Wins
Losses
Minutes Played
Points
Field Goals Made
Field Goals Attempted
Field Goal Percentage
3-pointers Made
3-pointers Attempted
3-pointers Percentage
Free Throws Made
Free Throws Attempted
Free Throw Percentage
Offensive Rebounds
Defensive Rebounds
Offensive Rebounds
Total Rebounds
Assists
Turnovers
Steals
Blocks
Personal Fouls
Example 1
position_SG 1
AGE 27
GP 41
W 9
L 32
MIN_PLAYED 1,154
PTS 503
FGM 173
FGA 414
FG_PERCENT 42
x_3PM 63
x_3PA 178
x_3P_PERCENT 35
FTM 94
FTA 106
FT_PERCENT 89
OREB 30
DREB 167
REB 197
AST 103
TOV 56
STL 41
BLK 4
PF 95
Example 2
position_SG 1
AGE 27
GP 56
W 23
L 33
MIN_PLAYED 1,847
PTS 1,129
FGM 408
FGA 949
FG_PERCENT 43
x_3PM 210
x_3PA 545
x_3P_PERCENT 38
FTM 103
FTA 122
FT_PERCENT 84
OREB 53
DREB 222
REB 275
AST 180
TOV 135
STL 50
BLK 16
PF 137
Example 3
position_PF 1
AGE 24
GP 55
W 19
L 36
MIN_PLAYED 1,071
PTS 638
FGM 221
FGA 393
FG_PERCENT 56
x_3PM 43
x_3PA 113
x_3P_PERCENT 38
FTM 153
FTA 204
FT_PERCENT 75
OREB 82
DREB 242
REB 324
AST 45
TOV 65
STL 25
BLK 48
PF 82
Conclusion
Overall, I am pleased with the results I received from my testing. I think that because I was using real salaries from the NBA the ranged from the low hundred thousands to north of $40 million, I had a bit of a challenge getting my accuracy scores to a better range. The limited number of players in the NBA was also an inhibiting factor. But because the NBA deals with millions and billions of dollars, I wouldn’t be uncomfortable guessing a salary with provided stats.
I enjoyed this project.
I learned a lot, including basics of how to scrape data.
You may see my code for how I scraped the salaries here.
And here is all that data merged together.
Additionally, here are the stats I used.
You can find my github for this project here.